2- Multiple graphs
Lets take the same example. But this time, we will compare the daily temperature for week1 and week2. So our file would look like this:
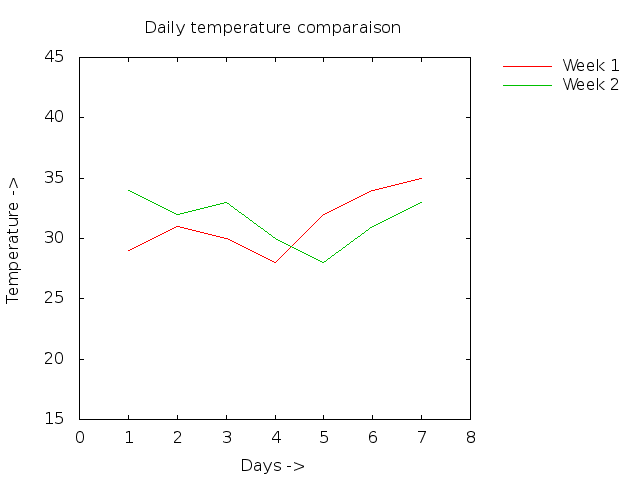
1 29 34
2 31 32
3 30 33
4 28 30
(...)
Only one line is going to be modified in our script file:
set key reverse Left outside

set term png

set output "Graph2.png"

set title "Daily temperature comparaison"
set xlabel "Days ->"
set ylabel "Temperature ->"

set offset 1,1,10,10

plot 'Data2' using 1:2 title 'Week 1' with lines, 'Data2' using 1:3 title 'Week 2' with lines

#Adding to the plot function another set of arguments. The two sets are structured the same, and separated by a coma.
The result will be as follows: