1- Simple graph :
For a basic ploting, you need a file with the dots coordinates (x,y).
The x and y axis are represented in a file by two lines separated (by default) by a space (other separator may be defined).
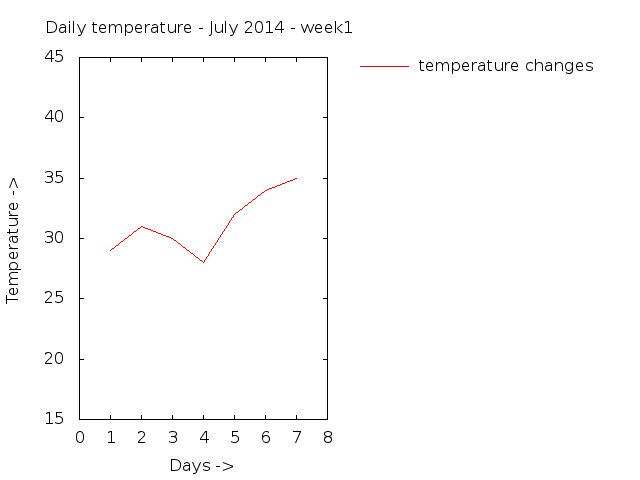
The following example shows the variation in temperature during the first week of July 2014:
1 29
2 31
3 30
4 28
5 32
6 34
7 35
Let's write a script that draws a graph for this data:
set key reverse Left outside #Graph's key is displayed outside the graph. Aligned : left

set term png #The result will be in png form

set output "graphs1.png" #Graph's name

set title "Daily temperature - July 2014 - week1 "    #Graphs title
set xlabel "Days ->"                     #Title of "X" axis
set ylabel "Temperature ->"                 #Title of "Y" axis


set offset 1,1,10,10 #Notice that the

plot 'Data1' using 1:2 title 'temperature changes' with lines

#ploting function: ploting datas from "Data1" file, using the 1st and 2nd row. Naming the graph "temperature changes", using straight lines.

#We can change line to one of these values: 'lines', 'points', 'linespoints', 'dots', 'impulses', 'yerrorbars', 'xerrorbars', 'xyerrorbars', 'steps', 'fs'
The result will be as follows: