3- Tips and trics:
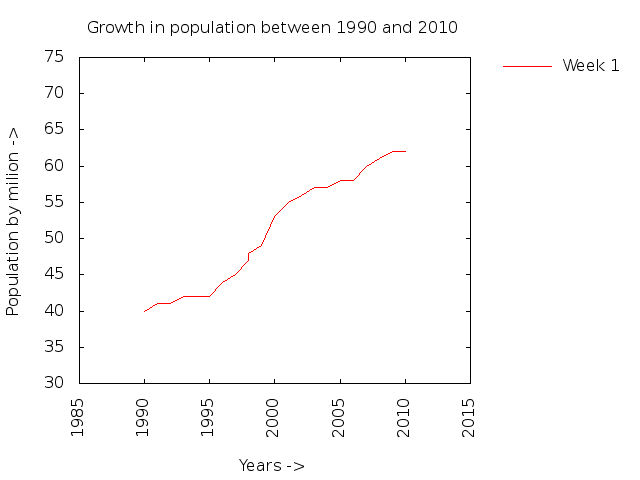
- Rotate data in axis for lisibility: Lets take the example of a population growth (million person) during the years. Data is as follows:
1990 40
1991 41
1992 41
1993 42
1994 42
1995 42
(...)
Sometimes we may want to rotat the display of the "X" axis (for better lisibility for example). It is done in the following script:
set key reverse Left outside

set term png

set xtics rotate #we are going to rotate the "X" to get a vertical display

set output "Graph3.png"

set title "Growth in population between 1990 and 2010"
set xlabel "Years ->"
set ylabel "Population by milion ->"

set offset 1,1,10,10

plot 'Data3' using 1:2 title 'Week 1' with lines
The result will be as follows:
- Using variables: We can generalise a script to use it with different data files, by the use of variables. Lets use the following data files Data1 and Data3.
The script will look like this:
set key reverse Left outside

set term png

set output pngname

set title graphtitle
set xlabel xtitle
set ylabel ytitle

set offset 1,1,10,10

plot datafile using 1:2 title

# <pngname> , <graphtitle> , <xtitle> , <ytitle> , <datafile> and <> are the name of variables that should be specified when calling this script file
The graph will then be generated with the following command:
With Data1:
gnuplot -e "pngname='Graph1.png'; graphtitle='Daily temperature'; xTitle='Days'; ytitle='Temperature'; datafile='Data1'" Script4
With Data2:
gnuplot -e "pngname='Graph3.png'; graphtitle='Growth in population'; xTitle='year'; ytitle='population'; datafile='Data3'" Script4
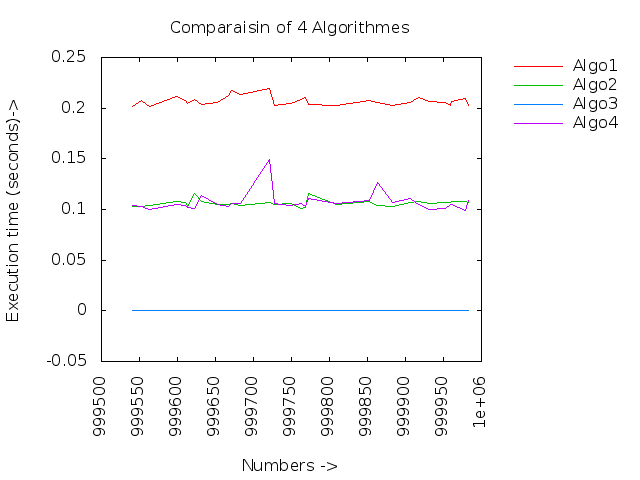
- Using the for loop:
When we have a repeated task to do, wecan use a loop to helps us. For example, we want to draw a graph representing the time taken by 6 different algorithms to check whether a number is prime or not. Data are represented in different files: Algo1 Algo2 Algo3 Algo4 The script will be:
set key reverse Left outside
set term png

set xlabel "Numbers ->"
set ylabel "Execution time (seconds)->"
set title "Comparaisin of 4 Algorithmes"

set xtics rotate

set offset 1,1,0.01,0.01

set output "graphs5.png"

plot for [i=1:4] 'Algo'.i using 1:2 title 'Algo'.i with lines

# The variable "i" takes the values 1 to 4 . So a translation of this would be:
# plot 'Algo1' using 1:2 title 'Algo1' with lines, 'Algo2' using 1:2 title 'Algo2' with lines, 'Algo3' using 1:2 title 'Algo3' with lines, 'Algo4' using 1:2 title 'Algo4' with lines,
The result will be as follows: